Wednesday, May 31, 2017

Lab 17(18th): Triangle

Title: Finding the moment of inertia of a uniform triangle about its center of mass

Purpose: Determine the moment of inertia of a uniform right triangle rotating about its center of mass in two different orientations.

Theory: The inertia of an unknown rotating object can be found by first rotating an object of known inertia and finding its angular acceleration by a constant force, then rotating the same object with the new unknown object attached and finding its angular acceleration and moment of inertia. Since inertia of an object can be thought of as a sum of the inertia of its components, by subtracting the two moments of inertia, the moment of inertia of just the unknown object may be found. A comparison may be made to the mathematical determination of the moment of inertia to verify the results.

Apparatus:

  • Rotating disc/pulley setup
  • Steel right triangle
  • Hanging mass
  • Logger Pro
  • Digital scale
  • Vernier caliper
Procedure:
Use a large diameter pulley wheel on the rotating discs and attach the triangle holding clamp without the triangle. Weigh the hanging mass to be used and rotate only the top steel disc to find its angular acceleration. Calculate a value of inertia for the top disc with attached clamp. Then, affix the triangle so that its longer non-hypotenuse side is oriented vertically. Conduct the same experiment to determine the angular acceleration of the triangle-disc system and calculate its inertia. Then, orient the triangle so that the previously vertical side is now the base of the triangle. Conduct the same experiment again and calculate a value of inertia.

Data and Graphs:

Photo of experimental apparatus:


Graphical analysis of disc-only system


Graphical analysis of vertically oriented triangle:


Graphical analysis of horizontally oriented triangle:


Table of collected and calculated data (Note: angular accelerations are all multiplied by x1.8 to account for calibration error):

Mtriangle 0,457 kg
Mhanging 0,025 kg
Dpulley 0,0499 m
Long side 0,1493 m
Short side 0,0986 m
System α up (rad/s^2) α down  α avg Isystem (kgm^2) Itriangle (kgm^2) Calculated I %Error
Disc 6,489 5,897 6,193 0,0009881 / /
Short base 5,216 4,691 4,954 0,001235 0,0002472 0,0002468 0,14827862
Long base 4,109 3,731 3,920 0,001561 0,0005727 0,0005659 1,203539002


Data Analysis:
To account for friction, an average angular acceleration was taken. Inertia of the system was calculating using t = I * r where r was the radius of the pulley and the torque was supplied by only the hanging mass. The theoretical moment of inertia was calculated using the equation I = 1/18 MB^2
and compared to experimental values.

Conclusion:
The moment of inertia of the experimental regular right triangle with its short side as its base is approximately 0.002472kgm^2, giving a percentage error of 0.148% compared to the theoretical value. When the triangle has its long side as the base, the moment of inertia was found to be approximately 0.0005727kgm^2, giving a percentage error of 1.20% compared to the theoretical value. These results, despite the error in calibration of the apparatus, are likely valid as much of the small error is due to the effects of friction which effectively increases the moment of inertia, producing the results seen in this experiment where experimental values were greater than theoretical values. The relatively few number of calculations also helped to reduce the error due to uncertainties in measurements.

Monday, May 29, 2017

Lab 18 (17th): Moment of Inertia and Frictional Torque

Title: Moment of Inertia and Frictional Torque

Purpose: Determine the frictional torque acting on a large metal disk rotating about a cylindrical shaft. Verify by observing the motion of a cart accelerating down a ramp.

Theory: The moment of inertia of an irregular large object composed of a number of smaller shapes with known inertia can be found by summing the inertia of its components about the axis of rotation. As the system being observed is not ideal and does experience friction, the magnitude of frictional torque may be found by finding the object's angular acceleration and using the equation t = I * a. To confirm this value of frictional torque, a theoretical linear acceleration of a cart down a ramp may be calculated using kinematics equations. The theoretical time the cart would take to travel a distance of 1 meter may then be compared to actual measured times.

Apparatus:

  • Rotating disc setup
  • Slow motion video capture
  • Vernier caliper
  • Logger Pro
  • Low friction cart
  • Cart track
  • String
Procedure:
Using the calipers, find the diameter and thickness of the 3 cylindrical sections of the rotating setup. Find the total mass of the disc which is stamped along one face of the large central cylinder.  Find the inertia of the three components using volume to find its mass and the equation I = 1/2MR^2. Use slow motion video capture to record the motion of the disc, following one point through approximately 4-7 slow rotations. In Logger Pro video analysis, record the time for the completion of each revolution by following the path of a single marked point. Set one rotation equal to 2 pi radians. Perform a second degree polynomial fit on a graph of angle rotated in radians vs time. The constant value of the x^2 term is 1/2 the angular acceleration. Using this value of angular acceleration, calculate a predicted value for the time it takes for a cart to travel 1 meter with a string attached to the smaller cylinder of the disc. 

Data and Graphs:

Photo of experimental disc apparatus:


Photo of video analysis:


Photo of graph (Note: this is the incorrect photo, a photo of the actual graph used was not taken):


Photo of cart and track setup


Table of collected data and calculated values:


Mcart 0,526 kg
Incline 45,6 °
Mdisc 4,808 kg
Diameter (m) Depth (m) V (m^3) M (kg) I (kgm^2) Total I α (rad/s^s) Frictional τ (Nm)
0,2006 0,0156 0,0004930 4,135 0,02080 0,02088 0,7676 0,01603
0,0314 0,0513 0,00003973 0,3332 0,00004106
0,0314 0,0523 0,00004050 0,3397 0,00004186

Predicted T 8,01 s
Actual T (s) Average T %Deviation %Error
7,83 8,018 -2,349 0,104
8,07 0,644
7,92 -1,226
8,16 1,767
8,13 1,393
8,00 -0,229

Data Analysis:
The derivation for the formula used to calculate linear acceleration is shown below:


Linear acceleration was then used in kinematics equations to produce a theoretical time.

Conclusion:
Our value of frictional torque of 0.01603Nm is very near the true value of frictional torque as the actual travel time of the cart differed from the expected travel time by only 0.104%. However, it was observed that the lubrication of the disc was a significant factor in determining the frictional torque as the disc, prior to additional lubrication, produced noticeable sound when rotating, signifying a greater loss of energy to friction. Even so, our data is valid because the two parts of the experiment, the determination of frictional torque and the comparison using a cart, were conducted in relatively quick succession and without additional use of the disc between experiments. Other factors that introduce error include the non-ideal nature of the low friction cart as it is not entirely frictionless. The string connecting the cart to the disc was unlikely to be perfectly parallel to the track and thus the actual torque applied by the cart on the disc may be lower than predicted, increasing the time taken to travel 1 meter down the ramp. This experiment had very few major potential sources of error and as such should produce reliable data. However, it was noted that some time measurements deviated rather largely from the average given the nature of this experiment, with one data point having 2.35% deviation. It would be possible to improve on the experimental procedure by hanging a mass vertically instead of sliding a cart to eliminate the presence of external friction forces and ensure that motion of the hanging mass is always perpendicular to the moment arm of the disc.


Monday, May 22, 2017

Lab 16: Angular Acceleration

Title: Angular Acceleration

Purpose: Find the relationship between torque and angular acceleration and determine the moment of inertia of a disc rotated by a constant force by measuring the magnitude of force used to accelerate the disc, the radius and mass of the disc, and the angular acceleration of the disc.

Theory: Newton's second law F=ma describes the motion as an object undergoes translational motion. This equation can also be related to rotational motion where torque t equals intertia I multiplied by angular acceleration a for t=Ia. By combining the use of these two equations where F=ma describes a falling mass and t=Ia describes a rotating object accelerated by the falling mass, an equation for inertia of the rotating object can be derived. This can then be compared to the mathematical solution to inertia where I=(1/2)mr^2 for a rotating disc.

Apparatus:

  • Steel disc (2)
  • Aluminum disc (1)
  • 50g masses (2)
  • 50g hanging mass (1)
  • Digital scale
  • Vernier caliper
  • String
  • Small radius pulley
  • Large radius pulley
  • Supplied experimental apparatus (see picture)
  • LoggerPro
Procedure:
Using the caliper and digital scale, measure the diameter and masses of the 2 steel and 1 aluminum discs. Using the small radius pulley, record the angular acceleration of a single rotating steel disc as it is pulled by masses of 50, 100g, and 150g (To rotate a single disc, insert a solid pin into the center of the disc). Then, using the large radius pulley and a 50g mass, measure and record the angular acceleration of a steel disc, an aluminum disc, and two steel discs. Using measurements of angular acceleration, calculate a value of inertia for each disc and compare to the true value calculated using mathematical methods.

Data and Graphs:

Photo of experimental setup and apparatus:


Table of collected and calculated data:

Msteel top 1,362 kg rsteel top 0,0632 m
Msteel bot 1,348 kg rsteel bot 0,0632 m
Maluminum 0,466 kg raluminum 0,0632 m
Mpulley-s 0,01003 kg rpulley-s 0,0124 m
Mpulley-l 0,03625 kg rpulley-l 0,02495 m
Mass (kg) Pulley Disc(s) α up (rad/s) α down α avg Inertia (kgm^2) True Inertia %Error
0,05 Small Steel 1,165 -1,315 1,240 0,002721 0,00272 0,0239
0,1 Small Steel 2,417 -2,614 2,516 0,002678 0,00272 -1,5469
0,15 Small Steel 3,556 -3,955 3,756 0,002686 0,00272 -1,2371
0,05 Large Steel 2,323 -2,671 2,497 0,002706 0,00272 -0,5350
0,05 Large Aluminum 6,591 -7,197 6,894 0,000969 0,00093 4,1102
0,05 Large 2 Steel 1,179 -1,297 1,238 0,005475 0,00541 1,1517

Graph of angular acceleration vs hanging mass (torque)


Graph of angular acceleration vs disc inertia


Data Analysis:
The equation used to calculate inertia was derived in class, the derivation is also included in the lab manual. Graphs were made based on the variable being changed (mass and inertia). The true value of inertia was calculated using the equation I = 1/2 MR^2 found using mathematics and integrals. Percentage error was calculated by comparing experimental values to the accepted true values of inertia.

Photo of derivation:


Conclusion:
Angular acceleration and torque applied are related linearly where an increase in torque will cause a proportional increase in angular acceleration. This is because torque and angular acceleration are directly related through the equation t=Ia. A graph of angular acceleration vs inertia produced an inverse relationship again corresponding to the previous equation where inertia multiplied by angular acceleration will equal a constant value of torque. In comparing our experimental inertia to the true inertia of each disc, it was found that most values differed by approximately 1% while the inertia of the aluminum disc differed by approximately 4%. This larger difference may be due to its lower mass as a lower value of inertia means that small errors become more significant in calculations. However, as seen in the different values of angular acceleration while the mass moved up and down, friction was not negligible. This would explain the greater value of inertia calculated for the aluminum disc as lower angular acceleration due to friction would make it appear as if the aluminum disc has greater inertia.

Monday, May 1, 2017

Lab 15: Ballistic Pendulum

Title: Ballistic Pendulum

Purpose: Determine the firing speed of a ball based on the height to which a target is knocked after an inelastic collision.

Theory: This experiment utilizes conservation of momentum and of energy where momentum of the ball and the target are conserved while the energy of the combined ball and target after collision is conserved as it moves upwards. During the collision, initial momentum of the ball mv is equal to the final momentum of the system (m+M)v. After the collision, the total kinetic energy will be equal to the maximum potential energy of the target and ball where 1/2mv^2 = mgh. Using the ballistic pendulum, angle measurements are taken instead and change in height may be calculated using trigonometric ratios. From this, maximum potential energy may be calculated and equated to maximum kinetic energy. The initial velocity of the ball and target system may then be found and conservation of momentum applied to find the initial velocity of the ball itself.

Apparatus:

  • Ballistic pendulum
Procedure:
Pull the ballistic pendulum back to its first locking slot. Adjust the ballistic pendulum as needed to ensure that the ball will accurately strike the target and embed itself. Adjust the ballistic pendulum to position the target directly adjacent to the angle marker at 0 degrees. Fire the gun and record the angle to which the marker was moved. Conduct at least 5 trials. For the second part of the experiment, place the launcher horizontally on a raised flat surface and fire the ball, measuring the height from which it was launched and the distance to which it flew. 

Data and Graphs:

Photo of experimental setup


Table of collected data and calculated values for part 1

Mball 7,6 g
Mtarget 79,7 g
Lstring 20,9 cm
Trial θ (°) Δh (m) Up = KE (J) v (m/s) vball (m/s) Uncertainty
1 17,1 0,009239 0,007913 0,4258 4,891 ± 0,2364
2 17 0,009132 0,007821 0,4233 4,862 ± 0,2358
3 18 0,010229 0,008760 0,4480 5,146 ± 0,2412
4 16,6 0,008711 0,007460 0,4134 4,749 ± 0,2337
5 16,5 0,008607 0,007371 0,4109 4,720 ± 0,2331
6 16,5 0,008607 0,007371 0,4109 4,720 ± 0,2331
Average: 4,8480 ± 0,2356
Table of collected data and calculated values for part 2
hball 0,205 m
L (m) Δt (s) vball (m/s) Uncertainty
1,047 0,2044 5,1214 ± 0,04892
1,060 0,2044 5,1850 ± 0,04892
1,062 0,2044 5,1948 ± 0,04892
1,065 0,2044 5,2095 ± 0,04892
Average: 5,1776 ± 0,04892
Percentage difference in values of initial velocity

%error
6,366235769


Data Analysis:
The change in height was calculated using Δh = L (1-cosθ), the maximum potential energy was calculating using U = mgΔh and equated to maximum kinetic energy. The velocity of the target with embedded ball was then found using EK = 1/2 mv^2. Conservation of momentum was then applied to find the velocity of the initial ball where mv of the ball equaled (m1+m2)v2 of the combined system.

Conclusion:
The velocity of the ball in part 1 was calculated to be 4.858m/s with an uncertainty of ±0.2356m/s. The velocity of the ball in part 2 was calculated to be 5.178m/s with an uncertainty of ±0.04982m/s.
The difference between these two calculated values is 6.366%. One likely cause for this error is that the two parts of the experiment were conducted during separate days, meaning that a different ballistic pendulum may have been used. Another possibility is that the collision experienced by the ball during the first part of the experiment did not conserve momentum and/or kinetic energy adequately, thus leading to a much lower calculated initial velocity. For this reason, the results of the second part of the experiment are more reliable as fewer energy transfers occur and fewer calculations need to be done to reach an answer. 

Thursday, April 27, 2017

Lab 15(14th): 2D Collision

Title: Collisions in Two Dimensions

Purpose: Determine whether or not momentum and total energy are conserved in a collision between two objects.

Theory:
During collision of an object, assuming no external forces, overall direction and magnitude of momentum is expected to be conserved. Kinetic energy is not expected to be conserved as the collision is non-elastic. These hypothesis can be tested by taking velocity measurements of the two objects prior to collision and after collision. Total momentum and kinetic energy can then be calculated according to the equations p = mv and Ek = 1/2 mv^2 and initial and final values can be compared.

Apparatus:

  • Smooth glass panel
  • Glass marble (2)
  • Steel ball bearing
  • Slow-motion video recording device
  • Camera positioning rig
  • Meter stick
Procedure:
Level the glass panel by adjusting the legs beneath the panel so that a ball remains stationary when placed. Position the video recording device in the rig set up above the glass panel so that most if not all of the glass panel is in frame. Position a meter stick on the glass panel within the video frame. Begin recording at at least 120 frames per second and collide the steel ball bearing with a stationary marble. Perform the experiment again by colliding two of the same type of marble. Perform video analysis using LoggerPro, skipping 2-4 frames for every data point to compensate for the increased FPS. Define an axis as parallel as possible to the initial motion of the moving ball prior to collision.

Data and Graphs:

Photo of experimental setup and the method used to produce data of position and velocity


Graphs of x and y velocities for a steel ball colliding with a marble


Graphs of x and y velocities for two marbles colliding


Table of x and y velocities, calculated change in momentum, and change in kinetic energy

Mmarble 5,2 g
Msteel 28 g
Δp = m(vf-vi)
Velocity (m/s)
Experiment 1 Steel Marble
X1 Y1 X2 Y2
Initial 0,3190 0 0 0
Final 0,2817 -0,0281 0,08207 0,1310
Δp (kgm/s) -0,00101 0,000804
ΔKE (J) -0,101 6,21E-05
Experiment 2 Marble 1 Marble 2
X1 Y1 X2 Y2
Initial 0,5181 0 0 0
Final 0,1499 -0,1233 0,2804 0,09052
Δp (kgm/s) -0,00168 0,00153
ΔKE (J) -0,268 0,000226


Data Analysis:
Using position graphs produced by video analysis, x and y velocities for the two balls in each experiment were found by using LoggerPro's linear fit option for graphical analysis. The slope of each graph was taken to be its velocity in that direction of motion. The magnitude of each ball's initial and final velocity was then found and used to calculate change in momentum and change in kinetic energy. 

Conclusion:
Momentum is not entirely conserved during the collision as the stationary object experienced a smaller change in momentum than did the initially moving object. In the first experiment, the second ball experienced a change in momentum of +0,00804kgm/s while the first ball experienced a change in momentum of -0,00101kgm/s, an approximately 21% difference. The second experiment produced more similar changes in momentum at -0,00168kgm/s for the first ball, giving a difference of approximately 9%.  Kinetic energy was not conserved as expected with the first ball losing 0,101J of kinetic energy and the second ball gaining only 0,0000621J of kinetic energy. 

Monday, April 24, 2017

Lab 14(13th): Impulse-Momentum

Title: Impulse-Momentum activity

Purpose: Verify that the impulse-momentum relationship holds true in a variety of situations.

Theory:
Impulse and momentum are directly related to each other where Ft=mv for an object such that some value of impulse will produce the same numerical change in momentum on an object. This relationship can be derived using kinematics equations where a given force will accelerate an object of mass m at a rate of F/m, the total change in velocity over a time interval t will be equal to (F*t)/m, and then the change in momentum is m((F*t)/m) which equals F*t, or impulse. By independent measurements of force, time, mass, and velocity of an object, impulse and momentum may be calculated and compared to verify their relationship in elastic and inelastic collisions.

Apparatus:

  • Spring loaded cart
  • Cart with force sensor attachment
  • Cart track
  • C-clamp
  • Clamp
  • Metal rod 
  • Motion detector
Procedure:
Level the cart track horizontally with one end near the edge of a table. Measure the mass of the cart with the force sensor attached. Using the C-clamp, metal rod, and clamp, secure the spring loaded cart at one end of the cart track so that the force sensor on the other cart will collide with the extended spring. Position the motion detector behind the force sensor cart. Lightly push the cart and collect data for position and force vs time. With the same setup, add more mass to the cart and collect the appropriate data. Then, replace the spring loaded cart with a clay mass and attach a sharpened screw to the force sensor. Push the cart so that it collides and sticks into the clay while collecting the appropriate data.

Data and Graphs:

Photo of the experimental setup


Mass of cart, initial and final velocities used to calculate change in momentum


Mcart 0,648 kg
Mcart2 1,148 kg

Velocities (m/s)
Experiment 1
Vi Vf
0,421 -0,296
Experiment 2
Vi Vf
0,404 -0,262
Experiment 3
Vi Vf
0,619 0

Graph of Force vs time and Velocity vs time for first collision, integral of force taken to find impulse


Graph of Force vs time and Velocity vs time for faster elastic collision
Note: graphs not aligned by Time axis


The clay target used to simulate an inelastic collision


Graph of Force vs time and Velocity vs time for inelastic collision with clay


Comparison of calculated momentum and force integrals from graphs

Δp=m Δv %error = (true value - experimental value)/true value *100
Calculated momentum (kgm/s) Force integral (Ns) % Error
Experiment 1
-0,465 -0,4866 -4,52
Experiment 2
-0,765 -0,8252 -7,35
Experiment 3
-0,401 -0,4070 -1,45


Data Analysis:
The initial and final velocities of the carts for each experiment were found by locating the points at which a force was exerted and the points at which the force stopped being exerted. From these values, the change in momentum was calculated according to the equation Δp=m Δ. Percentage error values were calculated using the force integral given by LoggerPro as the "true" value.

Conclusion:
For the first and third experiments, the percentage error between the force integral and the calculated momentum were both under 5% while the second experiment had a larger error at -7.35%. Overall, the calculated moments were all slightly lower values compared to impulse. Because the duration of each collision was very short at approximately 0.2 seconds for elastic collisions and 0.1 seconds for the inelastic collision, friction does not have a significant distance to act over and is thus negligible. The lower values of change in momentum may then be due to inaccuracies in finding the initial and final velocities. The force sensor was capable of producing a larger number of samples per second than the motion detector. This means that the force graphs will produce more accurate results as the entire collision will be more accurately described. In terms of finding the velocity of the object, this means that a corresponding point on the force graph may not have an exact time equivalent on the velocity graph, leading to uncertainties in calculated momentum. Assuming uncertainties in velocity of +-0.01m/s and an uncertainty in mass of 1g, the propagated uncertainties are shown below.

(dp/p) = (dm/m) * ((dv1/v1) + (dv2/v2))
dp = p ((dm/m) * ((dv1/v1) + (dv2/v2)))
Uncertainty in Momentum
Experiment 1
0,00719
Experiment 2
0,00893
Experiment 3
0,0100

The only value of impulse to fall within the uncertainty range of momentum is that of experiment 3, suggesting that is it probable that at least one of our idealized assumptions is false, that our method of data collection is inadequate, or that our experimental setup is flawed. 

Sunday, April 23, 2017

Lab 13 (12th): Magnetic Potential Energy

Title: Magnetic Potential Energy Lab

Purpose:
Determine a relationship for the repulsive force between two identical magnets while also verifying that conservation of energy applies to magnetic fields.

Theory:
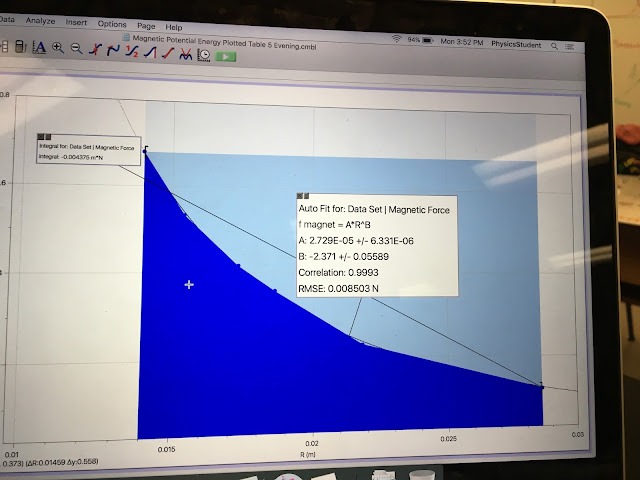
Forces due to gravitational and electric fields follow an inverse square law. Since magnetic forces also behave similarly in that they exert a force in a field, it is believed that a magnetic force should also behave according to some inverse power of distance in the form F=C(r^n) where C is an experimental constant for some particular situation, r is the distance between the magnets, and n is an experimental constant. By graphing measurements of force on one magnet and the resulting distance between the magnets, a model can be produced to predict the magnetic force at various distances r. As our experiment involves repulsive magnetic forces, we may test conservation of energy by graphing the motion of an object as it moves towards the magnet and finding the velocities at which it approaches and then retreats after being repelled.

Apparatus:

  • Strong magnet (2)
  • Air track and cart
  • Motion detector
  • Digital scale
  • Angle measurement device
Procedure:
Attach one magnet to the cart and one magnet to one end of the air track, facing towards the cart. Tilt the air track and measure its degree of inclination. With the air track on, release the cart and allow it to reach an equilibrium position. Measure the distance between the magnet on the cart and the magnet attached to the track. Repeat these steps for a total of 6 different angle measurements. Level the track and orient the two magnets towards each other at some relatively short distance. Measure the distance between the motion sensor and the area of the cart from which position is measured and measure the distance between the two magnets. Subtract the distance between the magnets from the distance between the cart and the motion detector to obtain a value used to convert position as measured by the motion sensor to distance between the magnets. With the air track on, slide the cart towards the fixed magnet and produce a graph of velocity vs time.

Data and Graphs:

Photo of experimental setup


Sample calculation of gravitational force equated to magnetic force

Fgrav = Fmagnet = Mcart*G*sin(θ) = 0.354*9.81*sin(0.035) = 0.118N

Sample calculation of magnetic potential energy Umagnet

Umagnet = integral F(r)dr = integral (2.729*10^-5)/(r^-2.371) = (-2.29*10^-5)/(1.371*(r^-1.371))

Sample calculation of distance between magnets r, used to create PE graph

r = measured position (from detector) - constant value = 20cm - 10.6cm = 9.4cm

Table of collected data and calculated values

Mass 345 g

θ (°) r (cm) θ (rad) Fgrav (N)
2,0 2,86 0,035 0,118
3,8 2,18 0,066 0,224
5,9 1,86 0,103 0,348
6,9 1,73 0,120 0,407
8,8 1,54 0,154 0,518
11,3 1,40 0,197 0,663

Graph of Force vs radius


Graph of kinetic, potential, and total energy (above) and of velocity (below)


Data Analysis:
The graph of force vs radius produced the experimental constants for our equation for magnetic force. Using LoggerPro's power fit ability, an equation was produced for the curve. The constant value C is equal to 2.729*10^-5 and the power n is equal to -2.371. Using the new equation of F=2.729*10^-5r^(-2.371), the total magnetic potential energy was calculated using the integral of force with respect to distance. From the velocity graph, a graph of kinetic energy vs time was produced. Using our equation for magnetic potential energy, a graph of potential energy vs time was produced. Total energy was then found by adding kinetic and potential energy. 

Conclusion:
The model produced for magnetic force was F=2.729*10^-5r^(-2.371) where r is the distance between two repelling magnets. This matches our prediction of an inverse power relationship between magnetic force and distance. Using this equation, the total potential energy shown in the first graph was calculated at  4.17*10^-3J. Based on the graphs produced of KE, PE, and total energy, it was concluded that energy is conserved in magnetic potential energy since no sudden decrease in total energy was observed. The gradual decrease in total energy is due to slight friction and air resistance as the cart moved along the track. Although calculations were not made to determine the exact total energy before and after the magnetic repulsion, it is assumed that these frictional forces are responsible for the slight decrease in total energy during the magnetic repulsion.